prometheus的API接口
PrometteusAPI官方详解
查询
查询当前prometheus健康状态
curl -X GET http://localhost:9090/-/healthy
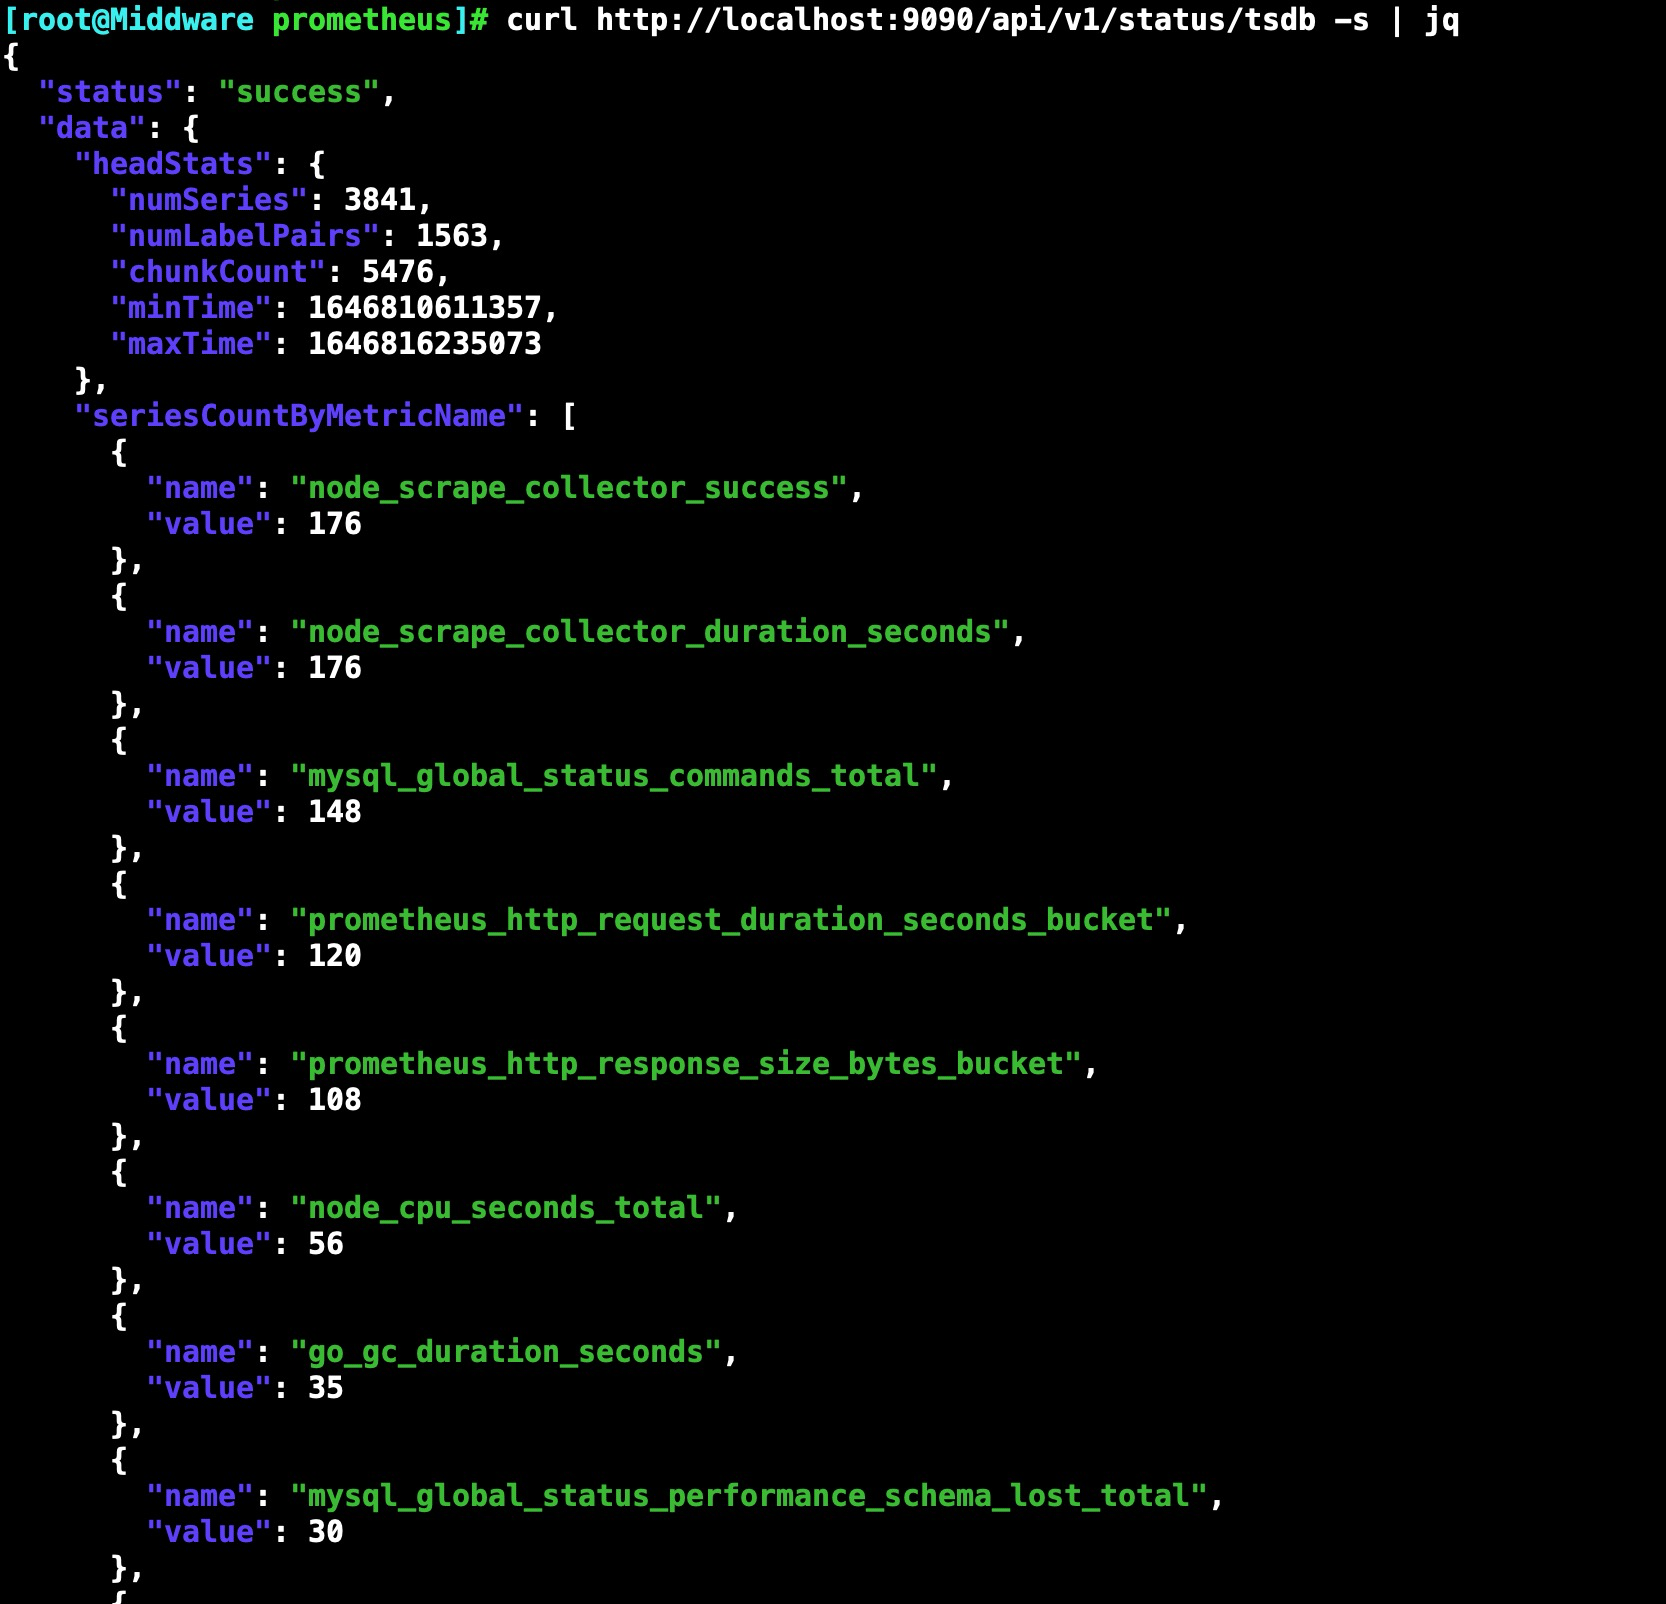
查询时序数据库当前的基数统计信息:
curl -s http://localhost:9090/api/v1/status/tsdb | jq
内容解释:
headStats :这提供了有关 TSDB 头块的以下数据: numSeries : 系列的数量。 chunkCount :块的数量。 minTime :当前最小时间戳,以毫秒为单位。 maxTime :当前最大时间戳(以毫秒为单位)。 seriesCountByMetricName: 这将提供指标名称及其系列计数的列表。 labelValueCountByLabelName: 这将提供标签名称及其值计数的列表。 memoryInBytesByLabelName 这将提供以字节为单位的标签名称和内存列表。 通过将给定标签名称的所有值的长度相加来计算内存使用量。 seriesCountByLabelPair 这将提供标签值对及其系列计数的列表。

获取当前警报管理器
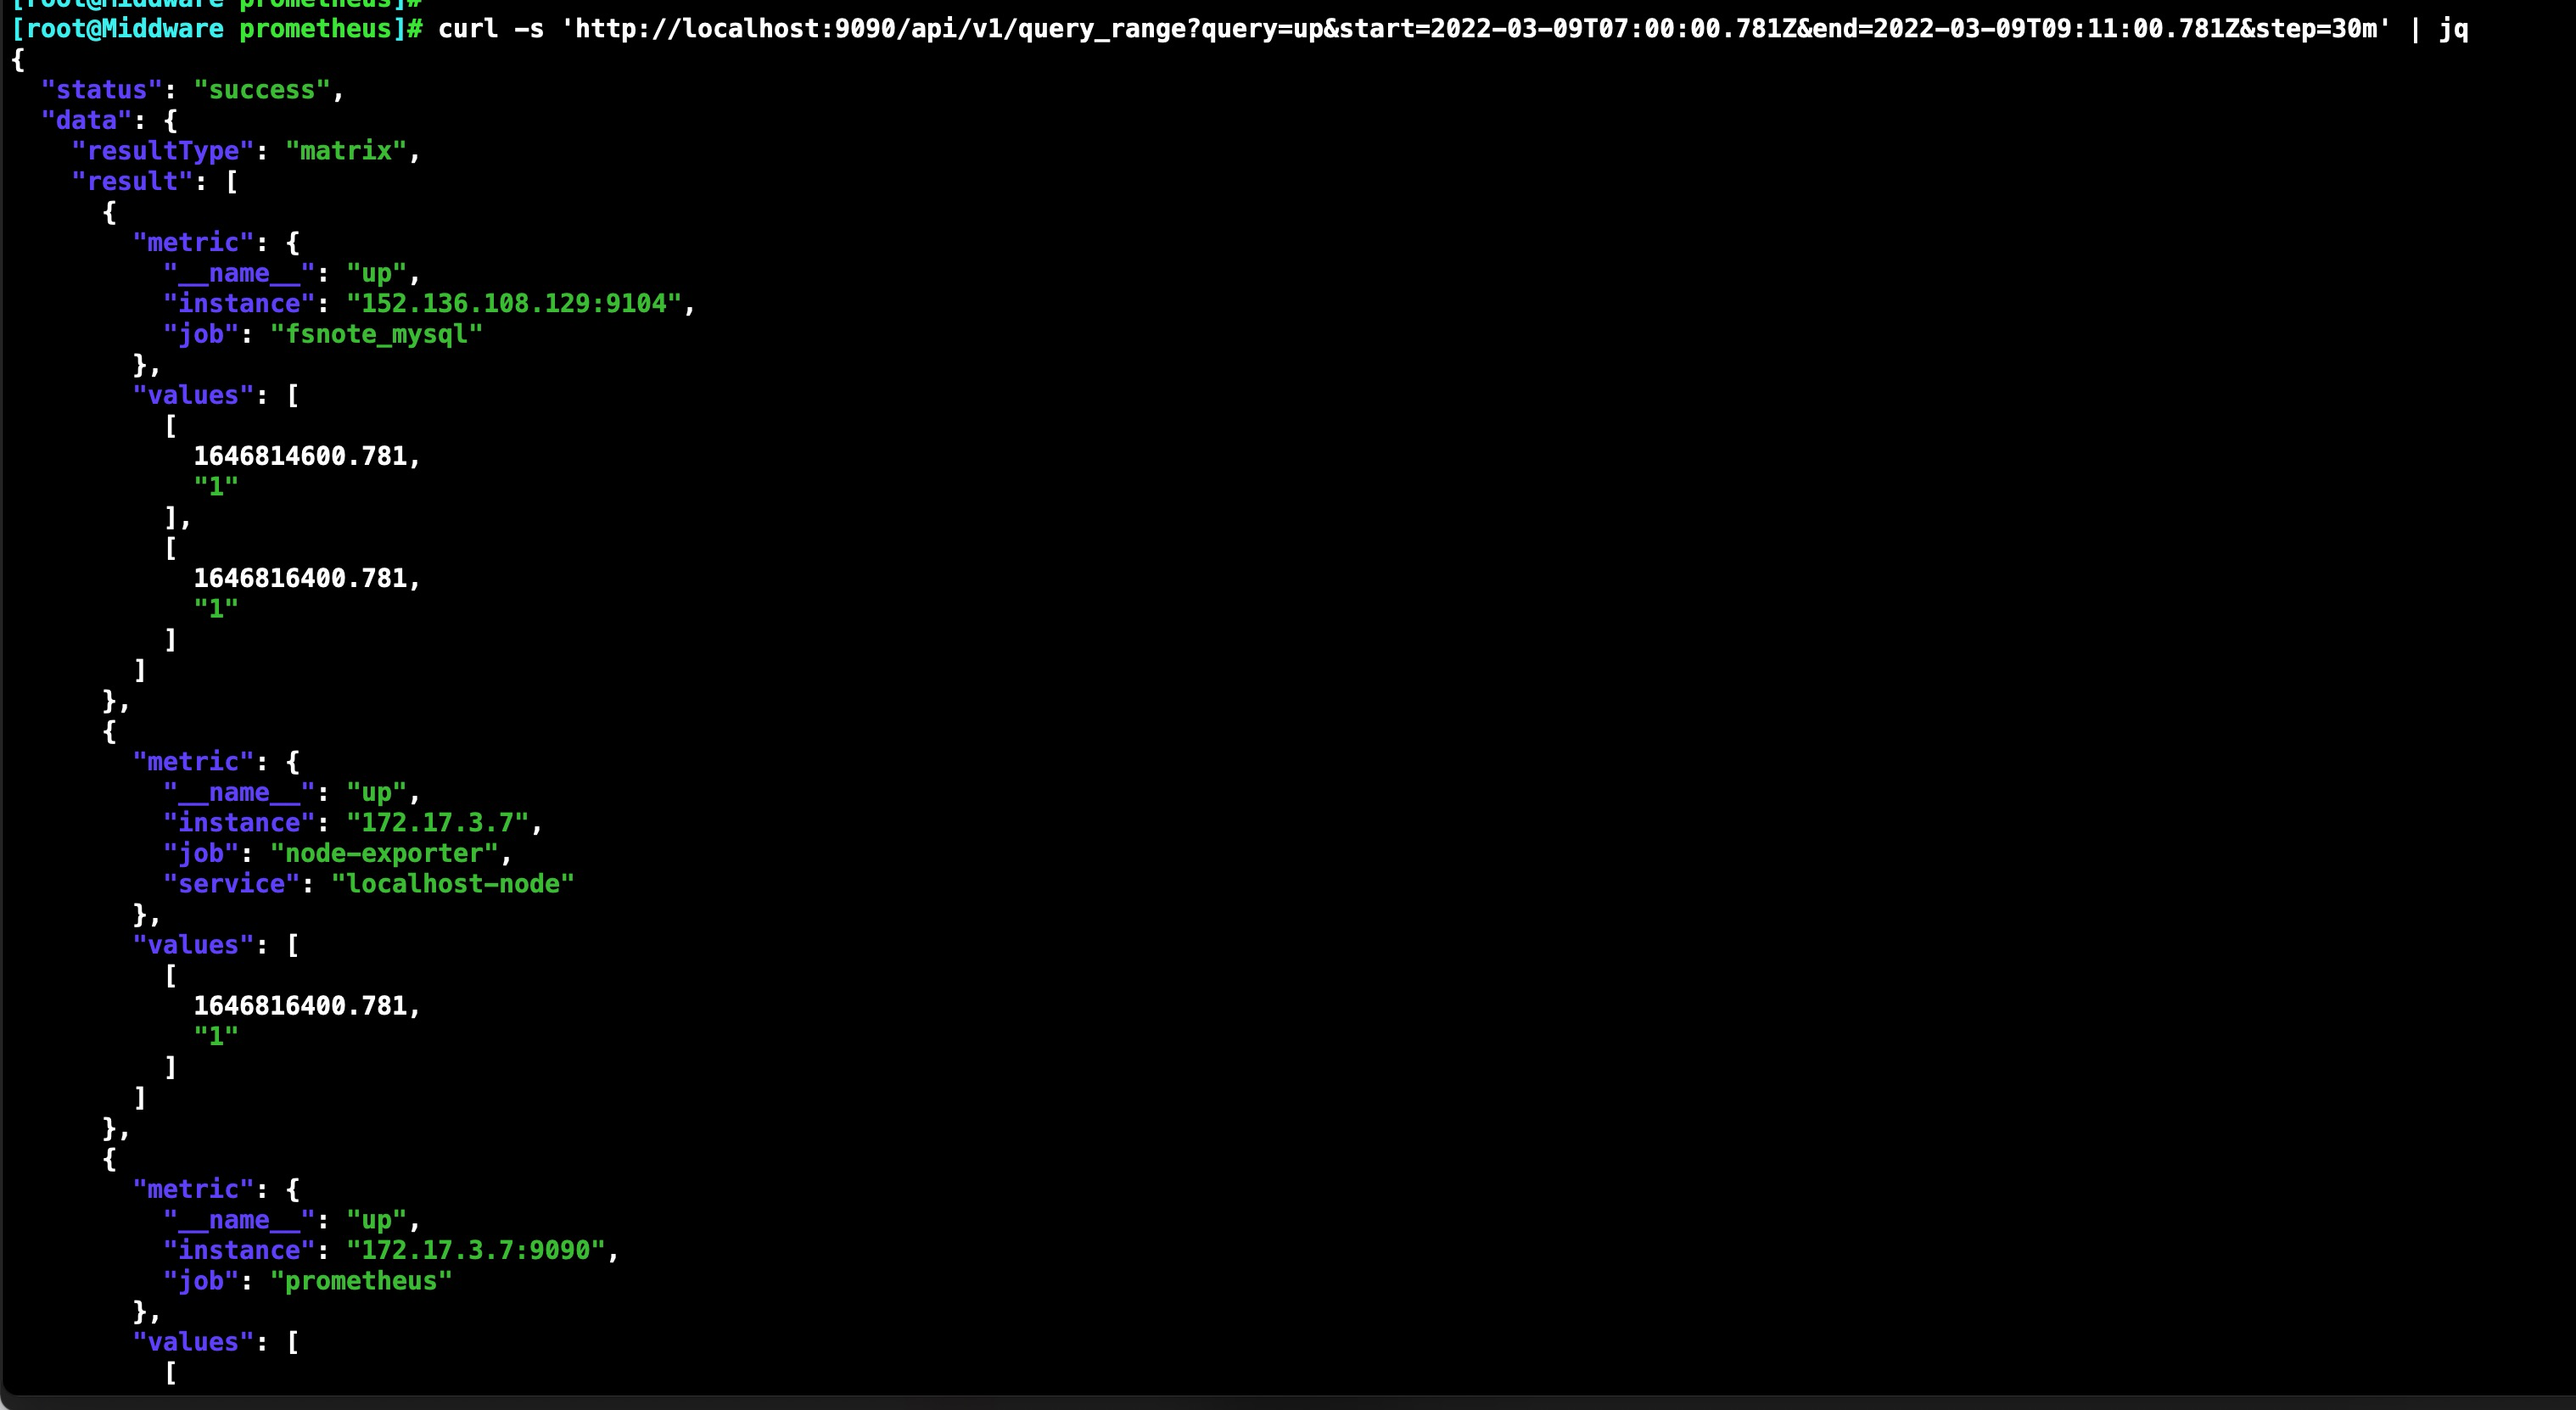
指定范围查询:
删除
删除实例: instance vm-192.168.1.124 # 但是好像没有删除
本文由作者按照
CC BY 4.0
进行授权